Introduction
In today’s fast-paced digital landscape, creating a visually appealing marketplace isn’t enough—you need to ensure that your design decisions lead to real user engagement and measurable results. For entrepreneurs and operators building on Sharetribe, data-driven design offers a smarter, more strategic approach to optimizing user experience. By leveraging tools like A/B testing and heatmaps, you can go beyond assumptions and tap into actual user behavior to guide layout changes, feature placements, and overall site structure.
This blog explores how you can use these powerful analytics tools to refine your Sharetribe marketplace, boost conversions, and build a platform that evolves intelligently with your users’ needs.
What is A/B Testing and Heatmaps?
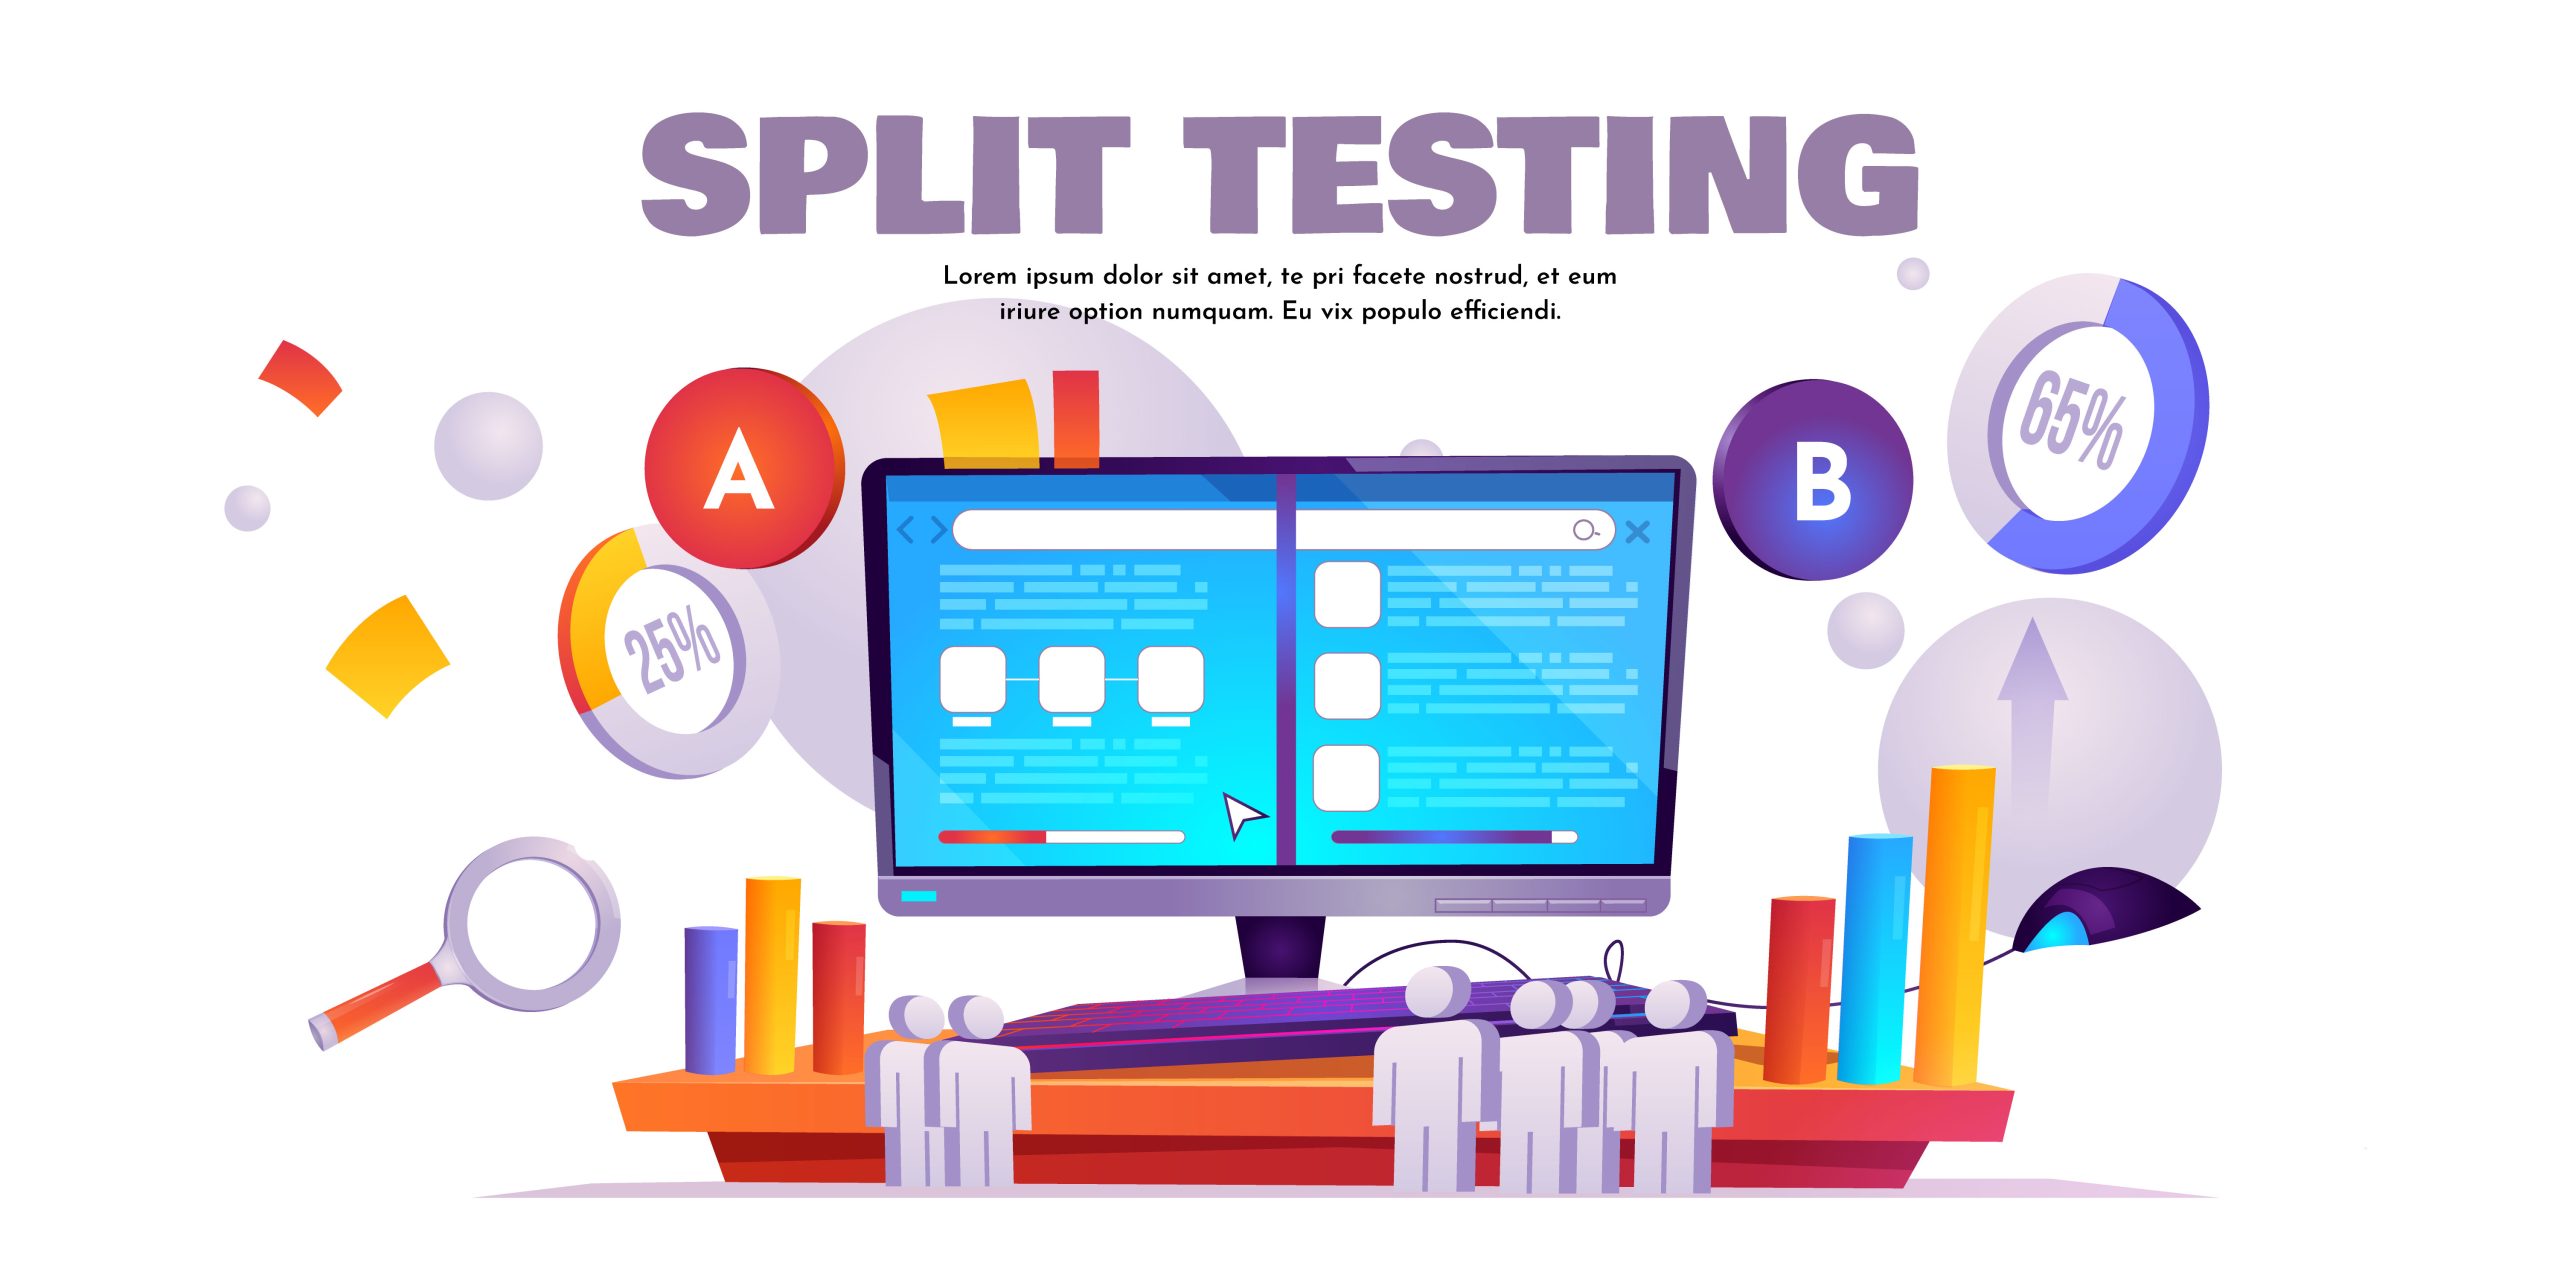
A/B Testing is a method of comparing two different versions of a web page, feature, or design element to determine which one performs better. For example, in a Sharetribe marketplace, you might create two versions of a homepage—Version A with a large “Sign Up” button and Version B with a smaller one. By splitting your audience and showing each version to a separate group of users, you can track which version results in more sign-ups, bookings, or clicks. It’s a scientific way to test hypotheses and make decisions based on performance data rather than assumptions.
Heatmaps, on the other hand, are visual tools that show where users are interacting on your site. They use colors to represent user activity—warm colors (like red and orange) indicate high engagement, while cooler colors (like blue and green) show low activity. Heatmaps can track clicks, mouse movements, scroll depth, and taps (on mobile). In your Sharetribe marketplace, heatmaps can help you understand which parts of a page attract the most attention, which CTAs are being ignored, and where users may be getting stuck or dropping off.
Together, A/B testing and heatmaps offer powerful insights into user behavior and are essential tools for any data-driven design strategy.
Why are A/B testing and heatmaps key to Sharetribe marketplace success?
1. Make Data-Backed Design Decisions
In marketplace design, relying on assumptions or subjective preferences can lead to ineffective changes. A/B testing allows you to make decisions based on real performance metrics—such as click-through rates, sign-ups, or bookings. Heatmaps, meanwhile, visually display how users engage with your platform. These tools help you identify what’s working and what isn’t.
For example, instead of guessing where to place your “List Your Service” button, you can test multiple positions and measure which performs better. Data-backed design removes the guesswork and increases your confidence in every change you implement.

2. Improve Conversion Rates
Every element of your Sharetribe marketplace—from homepage banners to CTA buttons—impacts your conversion rates. A/B testing enables you to experiment with variations of these elements to see which one leads to more successful user actions. For instance, if you’re trying to increase the number of bookings, you can test two different versions of your listing detail page. Over time, small iterative improvements can lead to a significant increase in conversions.
Heatmaps complement this by showing you which parts of your page are attracting attention and where users are clicking, allowing you to align high-performing elements with your conversion goals.
3. Identify User Friction Points
Heatmaps provide insights into where users experience confusion or hesitation. For example, if users are frequently clicking on non-interactive elements like images or headings, it may signal unclear navigation or misleading design. Scroll heatmaps show how far users scroll on a page, revealing if important content is being missed. These insights help you identify friction points in the user journey, such as forms that go unused, filters that are overlooked, or CTAs that are not being seen. Fixing these friction points leads to smoother navigation and increased task completion.
4. Enhance User Experience (UX)
A marketplace that is easy to use encourages users to stay longer and take action. By applying A/B testing and heatmap analysis, you can fine-tune the UX to meet user expectations. You might test changes to your search filters, homepage layout, or booking process to see what makes the platform more intuitive. Heatmaps show where users focus their attention and where they drop off, helping you reduce cognitive load and eliminate distractions.
An optimized UX increases user satisfaction, repeat visits, and referrals—critical drivers of marketplace success.

5. Optimize for Mobile vs. Desktop
User behavior differs significantly across devices. What works on desktop may not translate well to mobile. Heatmaps allow you to track taps, scrolls, and clicks separately for each device type. A/B tests can be segmented for mobile and desktop users, allowing you to test mobile-specific layouts, button sizes, or navigation menus. For Sharetribe marketplaces, where many users browse listings or make bookings on mobile, this device-specific testing ensures that the mobile experience is just as seamless and efficient as the desktop one.
6. Reduce Bounce and Exit Rates
A high bounce rate often signals that users aren’t finding what they need or are encountering friction. Heatmaps show where users lose interest or stop interacting. A/B testing lets you experiment with alternate content structures, more compelling CTAs, or improved visual hierarchy.
For example, if many users leave after landing on the homepage, you can test a new version with clearer value propositions or a simplified layout. Lowering your bounce and exit rates means users are more engaged and more likely to move through your funnel toward conversion.
7. Validate New Features or Changes
Whenever you introduce a new design element or feature—like a booking calendar, new listing card layout, or search filter—it’s important to validate its effectiveness. A/B testing allows you to roll out a new version to a subset of users and compare it with the existing one. This phased approach minimizes risk, as you can measure whether the new version improves engagement or conversion before committing to a full release. This is especially useful in Sharetribe’s custom frontends, where changes may require development resources—you want to ensure the investment is worthwhile.

8. Personalize User Experience
Different user segments interact with your marketplace in different ways. Sellers, buyers, first-time visitors, and repeat users often have unique needs and behaviors. A/B testing enables you to deliver tailored experiences to different segments. For instance, new users may respond better to educational content or onboarding prompts, while returning users may prefer quick access to search and favorites.
Heatmaps can show which segments focus on which areas of the page. By personalizing the experience based on this data, you can increase relevance, satisfaction, and loyalty.
9. Maximize ROI on Development Efforts
Customizing and developing new features or UI elements requires time, money, and technical resources. A/B testing ensures that your development investments lead to measurable improvements. Instead of launching a fully built feature and hoping for the best, you can test a lightweight version or mockup to gauge interest and performance.
Heatmaps also help developers and designers prioritize which parts of the platform need the most attention based on actual user interaction. This ensures you’re putting resources where they’ll have the greatest impact.
10. Foster a Culture of Continuous Improvement
Successful marketplaces are not built overnight—they evolve based on user behavior, market feedback, and performance data. A/B testing and heatmaps support a culture of continuous iteration. By regularly analyzing data, running experiments, and applying insights, you create a feedback loop that continually enhances your platform. This proactive mindset helps you stay ahead of competitors, adapt to user needs, and scale your marketplace effectively.
Conclusion
Optimizing your Sharetribe marketplace is not about guesswork—it’s about understanding your users and making decisions grounded in data. A/B testing and heatmaps offer powerful insights into how users interact with your platform, allowing you to refine layouts, improve user flows, and boost conversions with confidence.
By continually testing, analyzing, and iterating, you can create a user experience that not only meets expectations but also drives growth. Embracing data-driven design isn’t just a tactic—it’s a long-term strategy for building a smarter, more successful marketplace.
FAQ's
1. What tools can I use to implement A/B testing and heatmaps in my Sharetribe marketplace?
You can use tools like Google Optimize, Optimizely, or VWO for A/B testing, and Hotjar, Microsoft Clarity, or Crazy Egg for heatmaps. If you’re using a custom frontend with Sharetribe, these tools can be integrated directly into your site.
2. Do I need to be a developer to run A/B tests or use heatmaps?
Not necessarily. Most modern tools offer no-code or low-code options that allow you to create tests and view heatmaps with minimal technical knowledge. However, if you’re customizing your Sharetribe frontend, basic developer support may be needed for setup.
3. How long should I run an A/B test to get accurate results?
Ideally, you should run A/B tests for at least 1–2 weeks or until you reach a statistically significant number of users. The duration depends on your site traffic and the specific metric you’re testing (like sign-ups or bookings).
4. What should I test first in my marketplace?
Start with high-impact elements such as homepage layout, CTA buttons, listing card designs, or checkout flows. These areas directly affect user behavior and conversion rates, making them ideal for early testing.
5. Can heatmaps help improve mobile user experience?
Yes. Heatmaps can be set up specifically for mobile users, showing how users tap, scroll, and interact with your site on smaller screens. This helps you identify mobile-specific UX issues and optimize your design accordingly.


